Delulu
The MacOS that runs on Apple latops/systems is different from Linux, and at a very high level we can say that it's UNIX based, so it doesn't have support for the perf tool that we used so extensively in the previous profling blog.
To be able to benchmark the mat-mul code on an M4 CPU, we can quickly think of three realistic options:
Run Linux in a VM / container on the M4 and keep using perf.
Use a higher-level microbenchmarking tool (no low-level counters, just timings).
Use something MacOS specific.
I could run Linux in a VM and keep using perf but that is something I want to try later. I don't think we will have access to HW PM signals in VM(at least that was the case on my windows laptop).
In enters Xcode
I have only beein a Mac user for a few months now, and in terms of development, I am in a comfort zone with VSCode+nano :/
As it turns out, on Apple silicon, the official way to get hardware performance counters (instructions, branches, cache events, etc.) is Instruments which ships with Xcode and exposes low-level PMU events.
Step 1: Install Xcode command line tools:
xcode-select --installStep 2: Create a Counters template (GUI)
Open Instruments (via Xcode → Open Developer Tool → Instruments

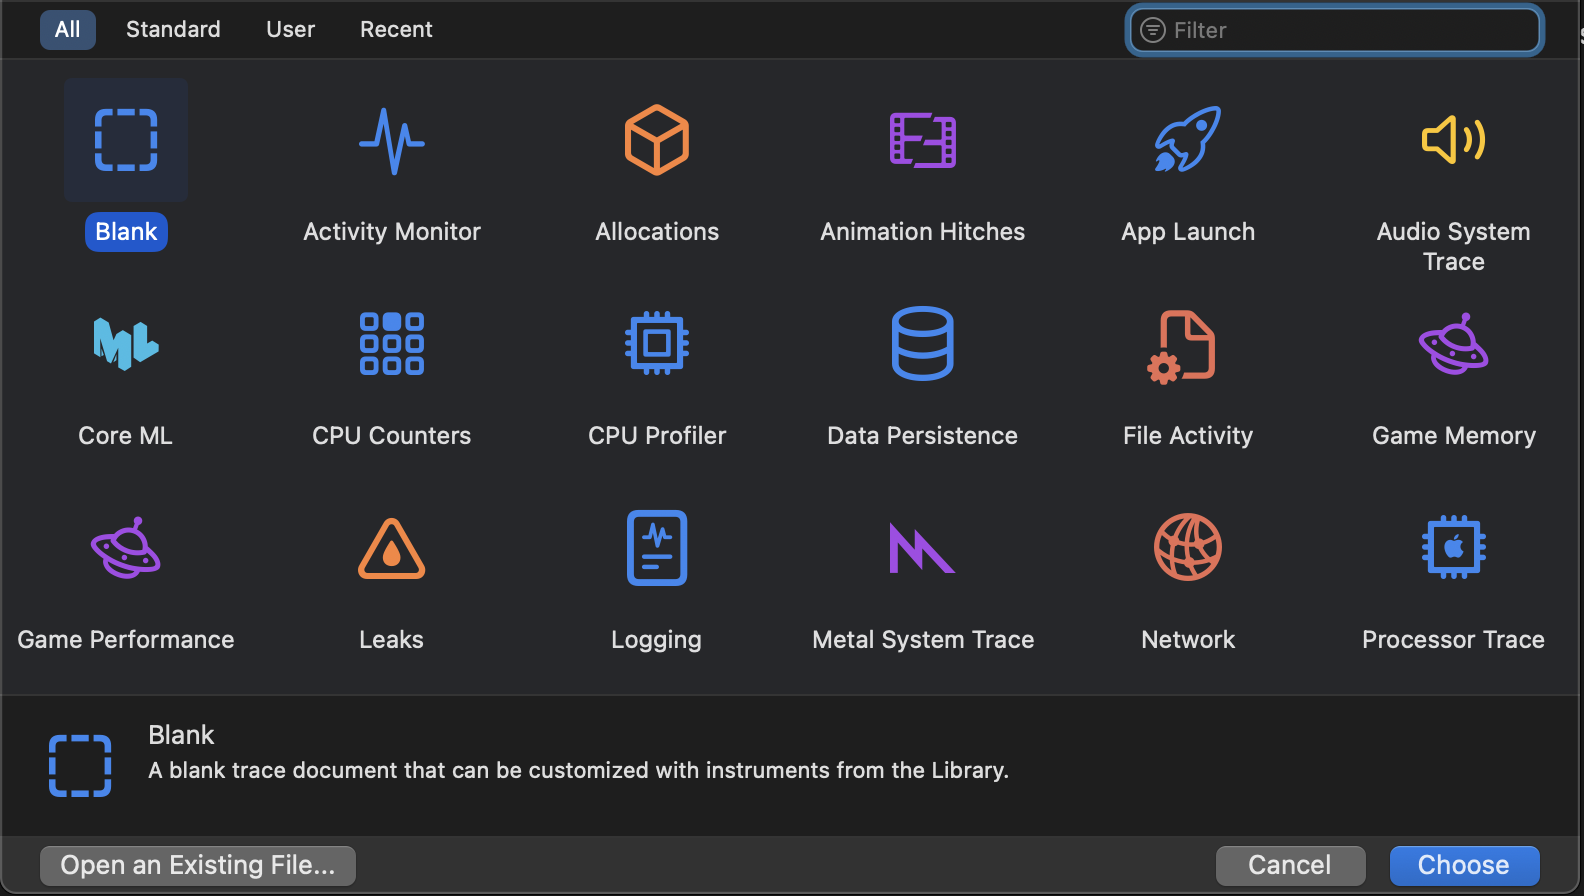
Choose the “CPU Counters” template.
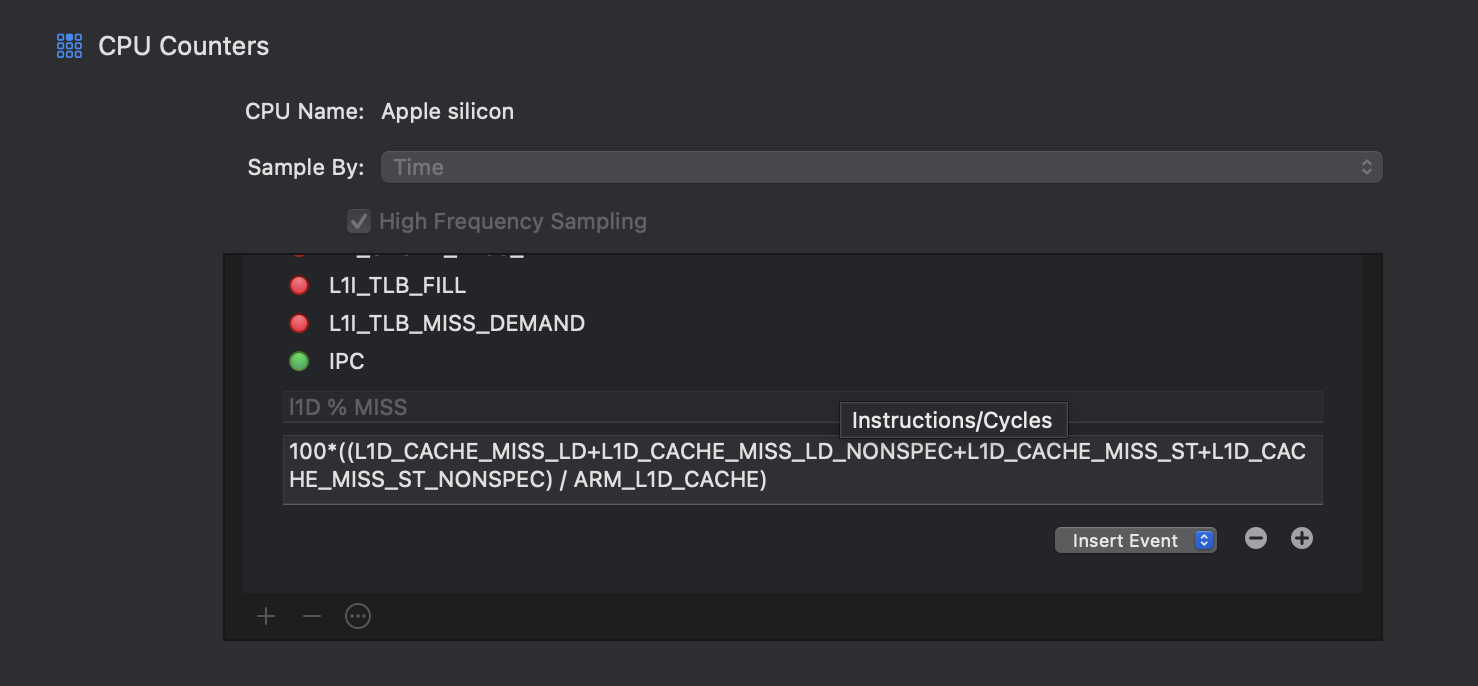
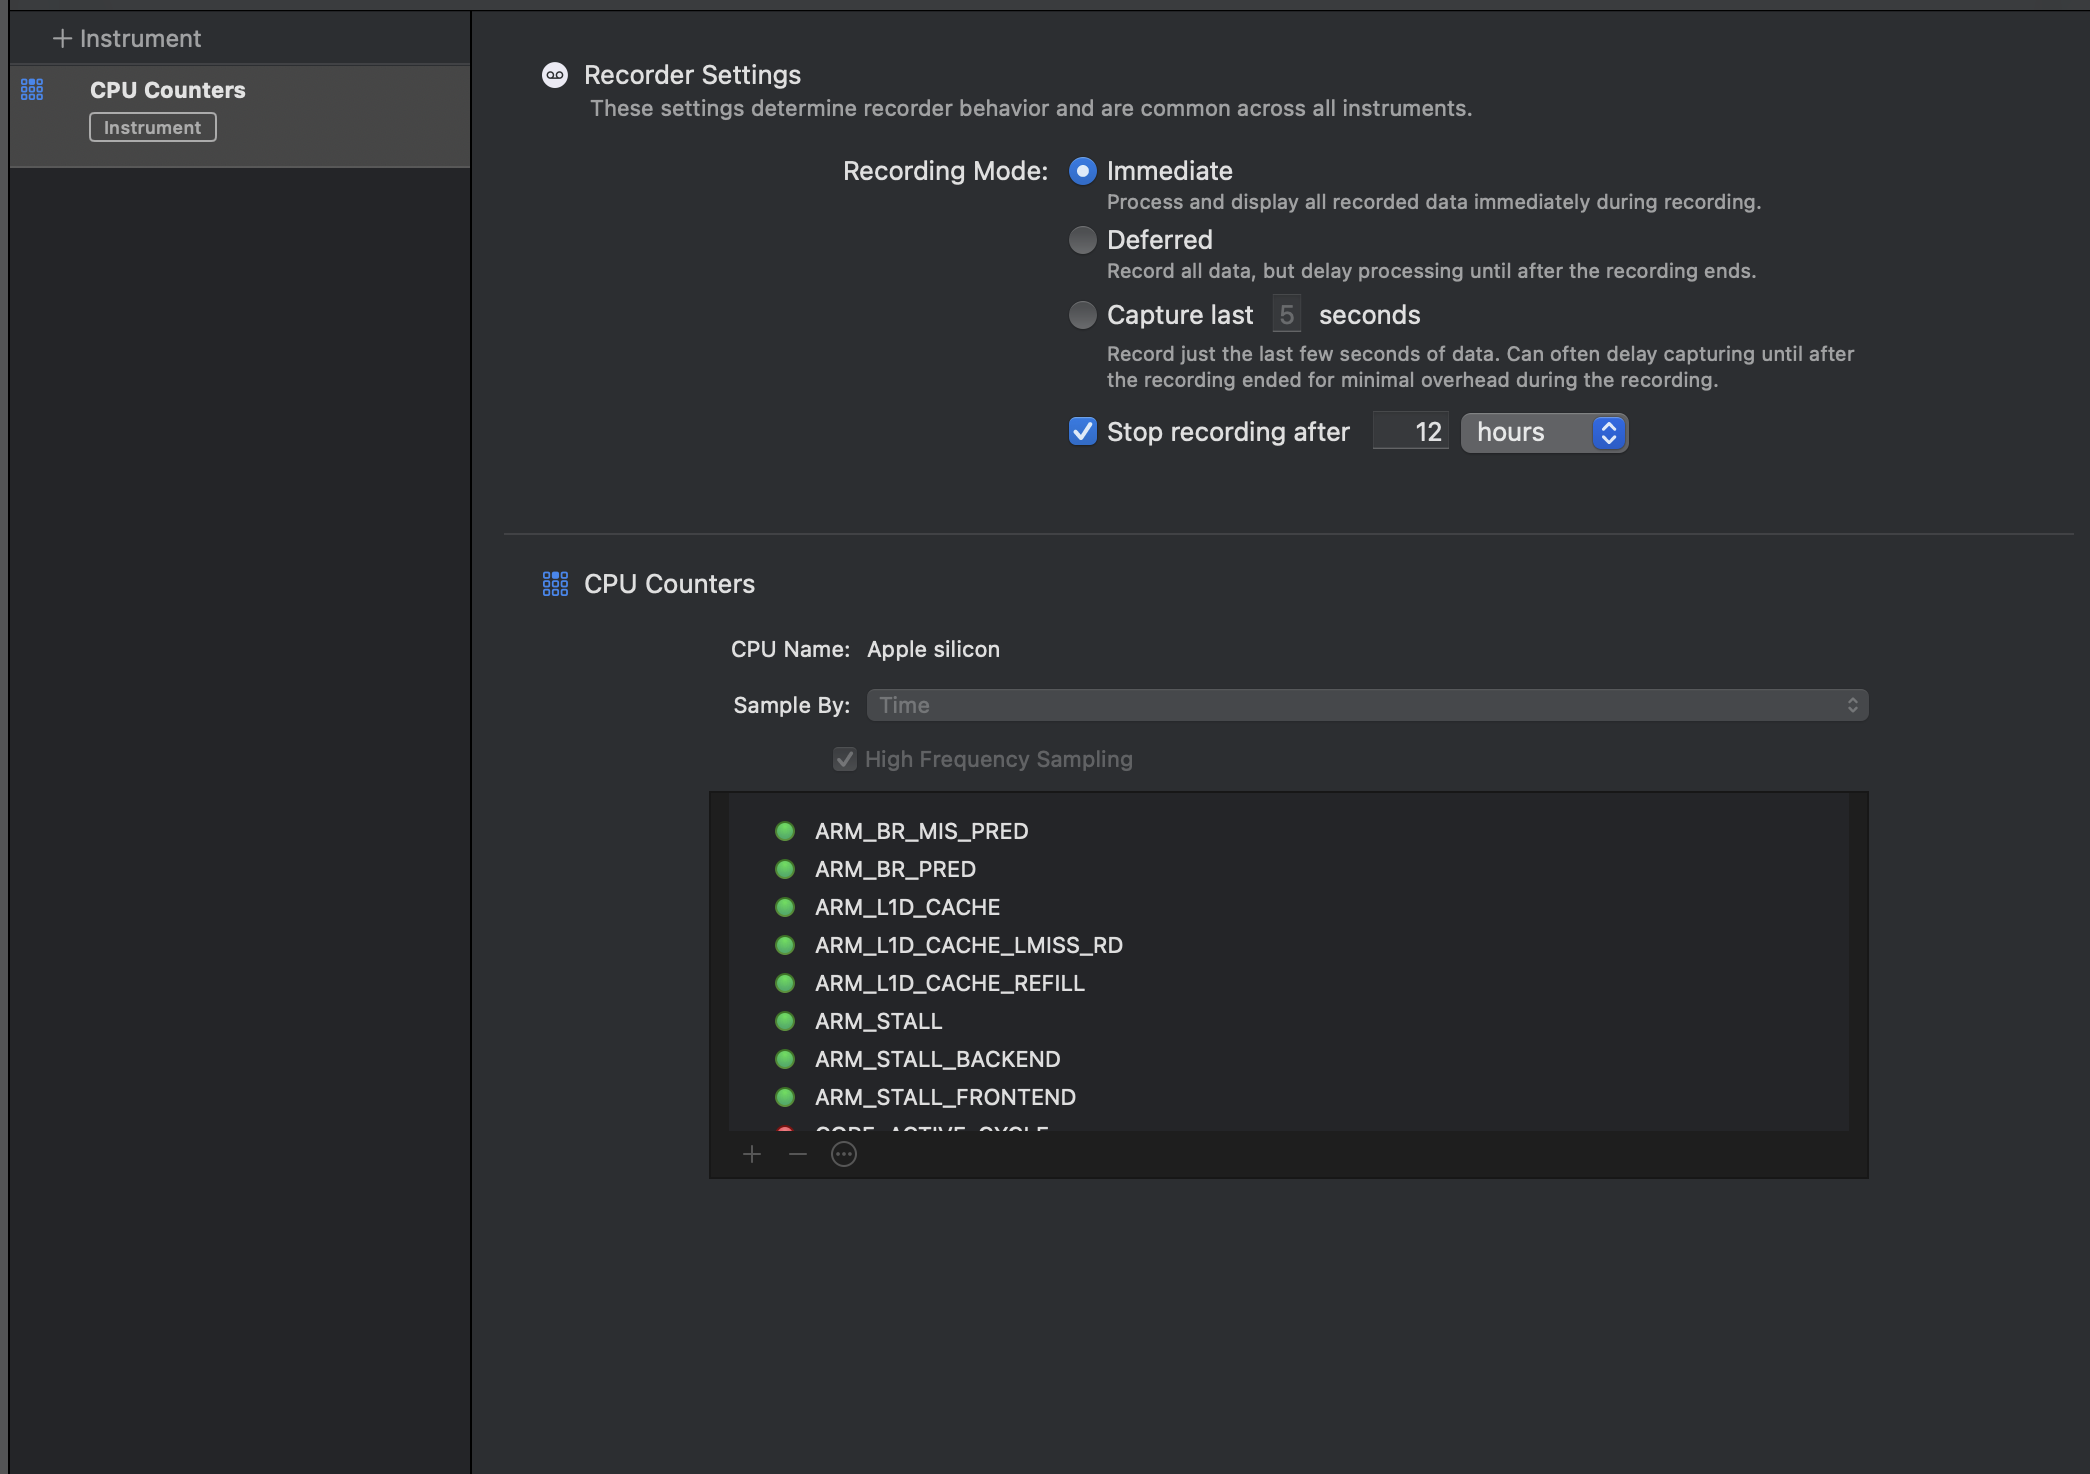 I was honestly surprised at the number/types of CPU counters exposed here, you can use the "+" sign to add more
we can also perform realtime arithmetic on these PMs to get usefule metrics, eg: in the image below I created formulae for IPC and & l1D cache misses.
Save this as a custom template, now we have a reusable template that’s roughly analogous to our
perf stat ...setup.
Step 3: Compile & Run the binary with xctrace
clang++ -march=native -O0 -o <simple_matmul_4096> -g ../../../specific_runner.cppxcrun xctrace record --template 'My Matmul Counters' --output matmul.trace --launch ./mat_mul