Introduction
It all started on the summer of 2025, when I was casually browsing through twitter(now X), and came across this gem of a blog post by Simon Boehm on Fast Multidimensional Matrix Multiplication on CPU from Scratch.
Fetching motivation from it, I decided to take a simple matrix multiplication code and optimize it in a cache-aware manner, while analyzing its performance.
Simple Matrix Multiplication
Let's start with a simple implementation of matrix multiplication in C++.
void basic_mat_mul(float* A, float* B, float* C)
{
    for(int i = 0;i < M; i++){
        for(int j = 0; j < K; j++){
            float val = 0.0;
            for (int inner =0; inner < N; inner++){
                val += A[i * N + inner] * B[j + inner * K];
            }
            C[i * K + j] = val;
        }}}
This classic i → j → inner loop order causes poor cache utilization because matrix B is accessed column-wise. Conceptually, each inner iteration jumps a large distance in memory:
B[0][j] → B[1][j] → B[2][j] → B[3][j] → ...Each access strides across an entire row of B, causing frequent cache misses, poor prefetching, low data reuse, and CPU stalls waiting for memory. The processor spends more time waiting than executing instructions — which is exactly what we see in the profiling data below.
Cache-aware Optimizations
Loop Reordering
void loop_reordered(int M, int N, int K, float* A, float* B, float* C)
{
    for(int i=0; i < M; i++){
        for(int inner =0; inner < N; inner++){
            for(int j=0; j<K; j++){
                C[i*K+j] += A[i*N + inner] * B[j+inner*K];
            }}}}
Half Tiling
void half_tiled_mm(int M, int N, int K, float* A, float* B, float* C)
{
    for(int i = 0;i<M;i++){
        for(int inner=0; inner<N/2;inner++){
            for(int j=0;j<K;j++){
                C[i*K+j] += A[i*N + inner] * B[j+inner*K];
            }
        }
    }
    for(int i = 0;i<M;i++){
        for(int inner=N/2; inner<N;inner++){
            for(int j=0;j<K;j++){
                C[i*K+j] += A[i*N + inner] * B[j+inner*K];
            }
        }
    }
}
Inner Loop Tiling
void inner_tiled_mm(int M, int N, int K, float* A, float* B, float* C, int tile_size)
{
    for(int tile = 0; tile<N; tile+=tile_size) {
        for(int i = 0;i<M;i++){
            int end_tile = std::min(N, tile+tile_size);
            for(int inner=tile; inner<end_tile; inner++){
                for(int j=0;j<K;j++){
                    C[i*K+j] += A[i*N + inner] * B[j+inner*K];
                    }}}}}
Full Tiling
void fully_tiled_mm(int M, int N, int K, float* A, float* B, float* C, int tile_size)
{
    for(int row = 0; row<M; row+=tile_size) {
        for(int col = 0;col<K;col+=tile_size){
            for(int inner=0; inner<N; inner++){
                for(int block_row=row; block_row< std::min(row + tile_size, M); block_row++){
                    for(int block_col=col; block_col< std::min(col + tile_size, K); block_col++){
                        C[block_row*K+block_col] += A[block_row*N + inner] * B[block_col+inner*K];
                    }}}}}}
Profiling Results
We profiled each implementation on a 4096×4096 matrix using both Linux perf and AMD uProf. All runs used -O0 (no compiler optimizations) and were pinned to CPU core 3 with numactl to isolate the impact of our manual cache-aware optimizations. See the profiling blog for a deeper analysis.
Linux perf
Profiling command:
sudo perf stat -e "L1-dcache-loads,L1-dcache-load-misses,L1-dcache-prefetches,L1-icache-loads,L1-icache-load-misses,dTLB-loads,dTLB-load-misses,iTLB-loads,iTLB-load-misses,branch-loads,branch-load-misses,branch-instructions,branch-misses,cache-misses,cache-references,cpu-cycles,instructions" -C 3 numactl -C 3 ../../matmul_perf_profiling-master/simple_matmulPerformance comparison (relative to basic mat mul baseline):
| Approach | CPU Cycles | Instructions | IPC | L1 D-cache Miss Rate | dTLB Miss Rate | LLC Miss Rate |
|---|---|---|---|---|---|---|
| Basic Mat Mul | 338.25B | 45.05B | 0.13 | 38.58% | 18.50% | 50.39% |
| Loop Reordered | ↓ 37.61B | ↑ 54.18B | ↑ 1.44 | ↓ 16.03% | ↓ 4.28% | ↓ 0.81% |
| Inner Tiling | ↓ 30.96B | ↑ 58.07B | ↑ 1.88 | ↓ 14.28% | ↓ 12.26% | ↓ 11.78% |
Analysis
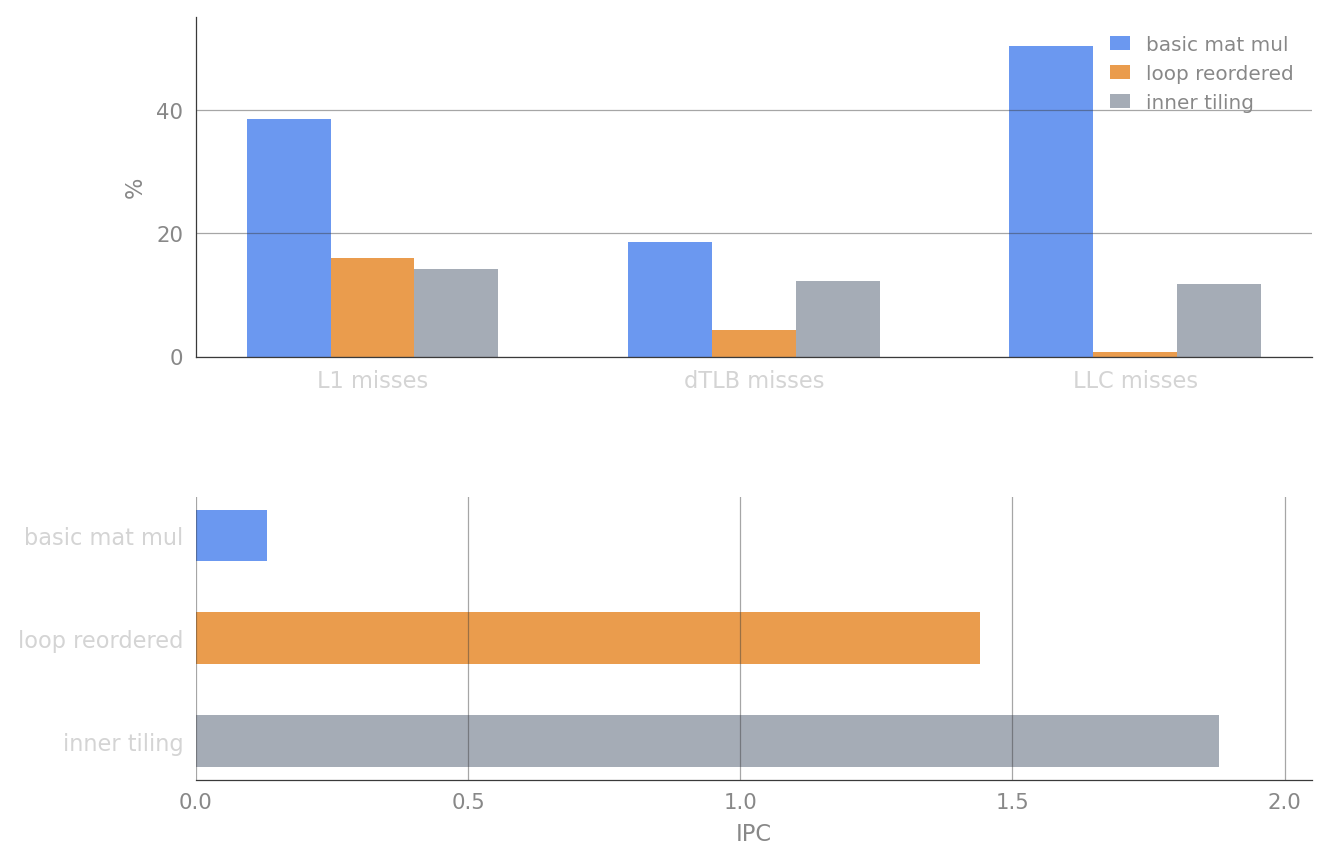
The naive i → j → k loop accesses B column-wise, striding across entire rows on every inner iteration. The CPU spends most of its time stalled on memory, giving an IPC of only 0.13. Loop reordering to i → k → j walks contiguous elements of B and improves spatial locality — IPC jumps to 1.44 and LLC miss rate drops from 50.4% to 0.81%.
Inner tiling pushes IPC further to 1.88, but compared to loop reordered, both dTLB and LLC miss rates go up:
| Metric | Reordered | Tiled |
|---|---|---|
| IPC | 1.44 | ↑ 1.88 |
| dTLB Miss Rate | 4.28% | ↑ 12.26% |
| LLC Miss Rate | 0.81% | ↑ 11.78% |
At first glance this looks contradictory — higher miss rates but better performance. Lower miss rate ≠ higher performance. IPC measures how much useful work the CPU completes per cycle, not how few misses occurred.
Data Reuse
Without tiling, an element of A is loaded, used once in a single multiply-accumulate, and evicted. With a tile size of 64, the same element of A participates in 64 consecutive inner-loop iterations before the tile advances — amortizing the load cost across many computations. Tiling is designed to keep working sets of A, B, and C resident in cache while reusing them.
Instruction-Level Parallelism
A single C[i][j] += A[i][k] * B[k][j] creates one dependent accumulation chain: the CPU must serialize Load → Multiply → Add → Repeat. A tiled kernel updates multiple C elements (C00, C01, C10, C11, …) that are independent of each other. The out-of-order scheduler can issue multiplies and loads for different accumulators in parallel, overlapping computation with memory latency.
Miss Rates vs IPC
Consider two programs: A has 10 cache misses but 100 independent instructions; B has 5 cache misses but 100 dependent instructions. Program A can achieve higher IPC because the CPU overlaps independent work while waiting for memory. Program B stalls more despite fewer misses. This is why miss rates and IPC must always be analyzed together — a lower miss rate does not guarantee higher throughput.
Computing Actual Misses
Miss rates are percentages of total accesses. To understand real impact, multiply by the access counts from perf:
dTLB misses — a dTLB miss triggers a page table walk (~100 cycles) to resolve a virtual address.
Loop reordered ( dTLB loads at ):
Inner tiling ( dTLB loads at ):
That's only additional misses. At 100 cycles per page walk:
Against total cycles for inner tiling:
dTLB misses are real and costly per event, but too infrequent to dominate runtime here.
LLC misses — computed from cache-references × miss rate:
Loop reordered ( references at ):
Inner tiling ( references at ):
LLC misses increase ~20×, yet inner tiling still achieves higher IPC (1.88 vs 1.44) and fewer total CPU cycles (30.96B vs 37.61B). The tiled kernel extracts more computation per byte loaded through better cache blocking, register reuse, and ILP — gains that outweigh the higher miss counts.
Cache-miss rates alone do not determine performance.
Naive:          Load → Wait → Compute
Loop Reordered: Load → Compute
Tiled:          Load Once → Compute Many Times
AMD uProf
Performance comparison (4096×4096, relative to basic mat mul baseline):
| Approach | Runtime (s) | Speedup | IPC | CPI | L1 D-cache Miss Rate | DRAM Refills (PTI) |
|---|---|---|---|---|---|---|
| Basic Mat Mul | 296.76 | 1.00× | 1.14 | 0.87 | 12.27% | 0.046 |
| Loop Reordered | ↓ 183.34 | ↓ 1.62× | ↑ 3.19 | ↓ 0.33 | ↓ 0.38% | ↓ 0.0003 |
| Half Tiled | ↓ 182.82 | ↓ 1.62× | ↑ 3.17 | ↓ 0.32 | ↓ 0.82% | ↓ 0.0005 |
| Inner Tiled (64) | ↓ 179.23 | ↓ 1.66× | ↑ 3.22 | ↓ 0.31 | ↓ 0.82% | ↓ 0.0004 |
| Inner Tiled (512) | ↓ 188.93 | ↓ 1.57× | ↑ 3.20 | ↓ 0.31 | ↓ 0.82% | ↓ 0.0001 |
| Fully Tiled (512) | ↑ 388.98 | ↑ 0.76× | ↑ 3.02 | ↓ 0.33 | ↓ 0.30% | ↓ 0.0009 |
| Fully Tiled (64) | ↑ 372.29 | ↑ 0.80× | ↑ 3.00 | ↓ 0.33 | ↓ 0.39% | ↓ 0.0044 |
| SIMD MatMul | ↓ 50.54 | ↓ 5.87× | ↑ 2.23 | ↓ 0.45 | ↓ 2.14% | ↓ 0.0007 |
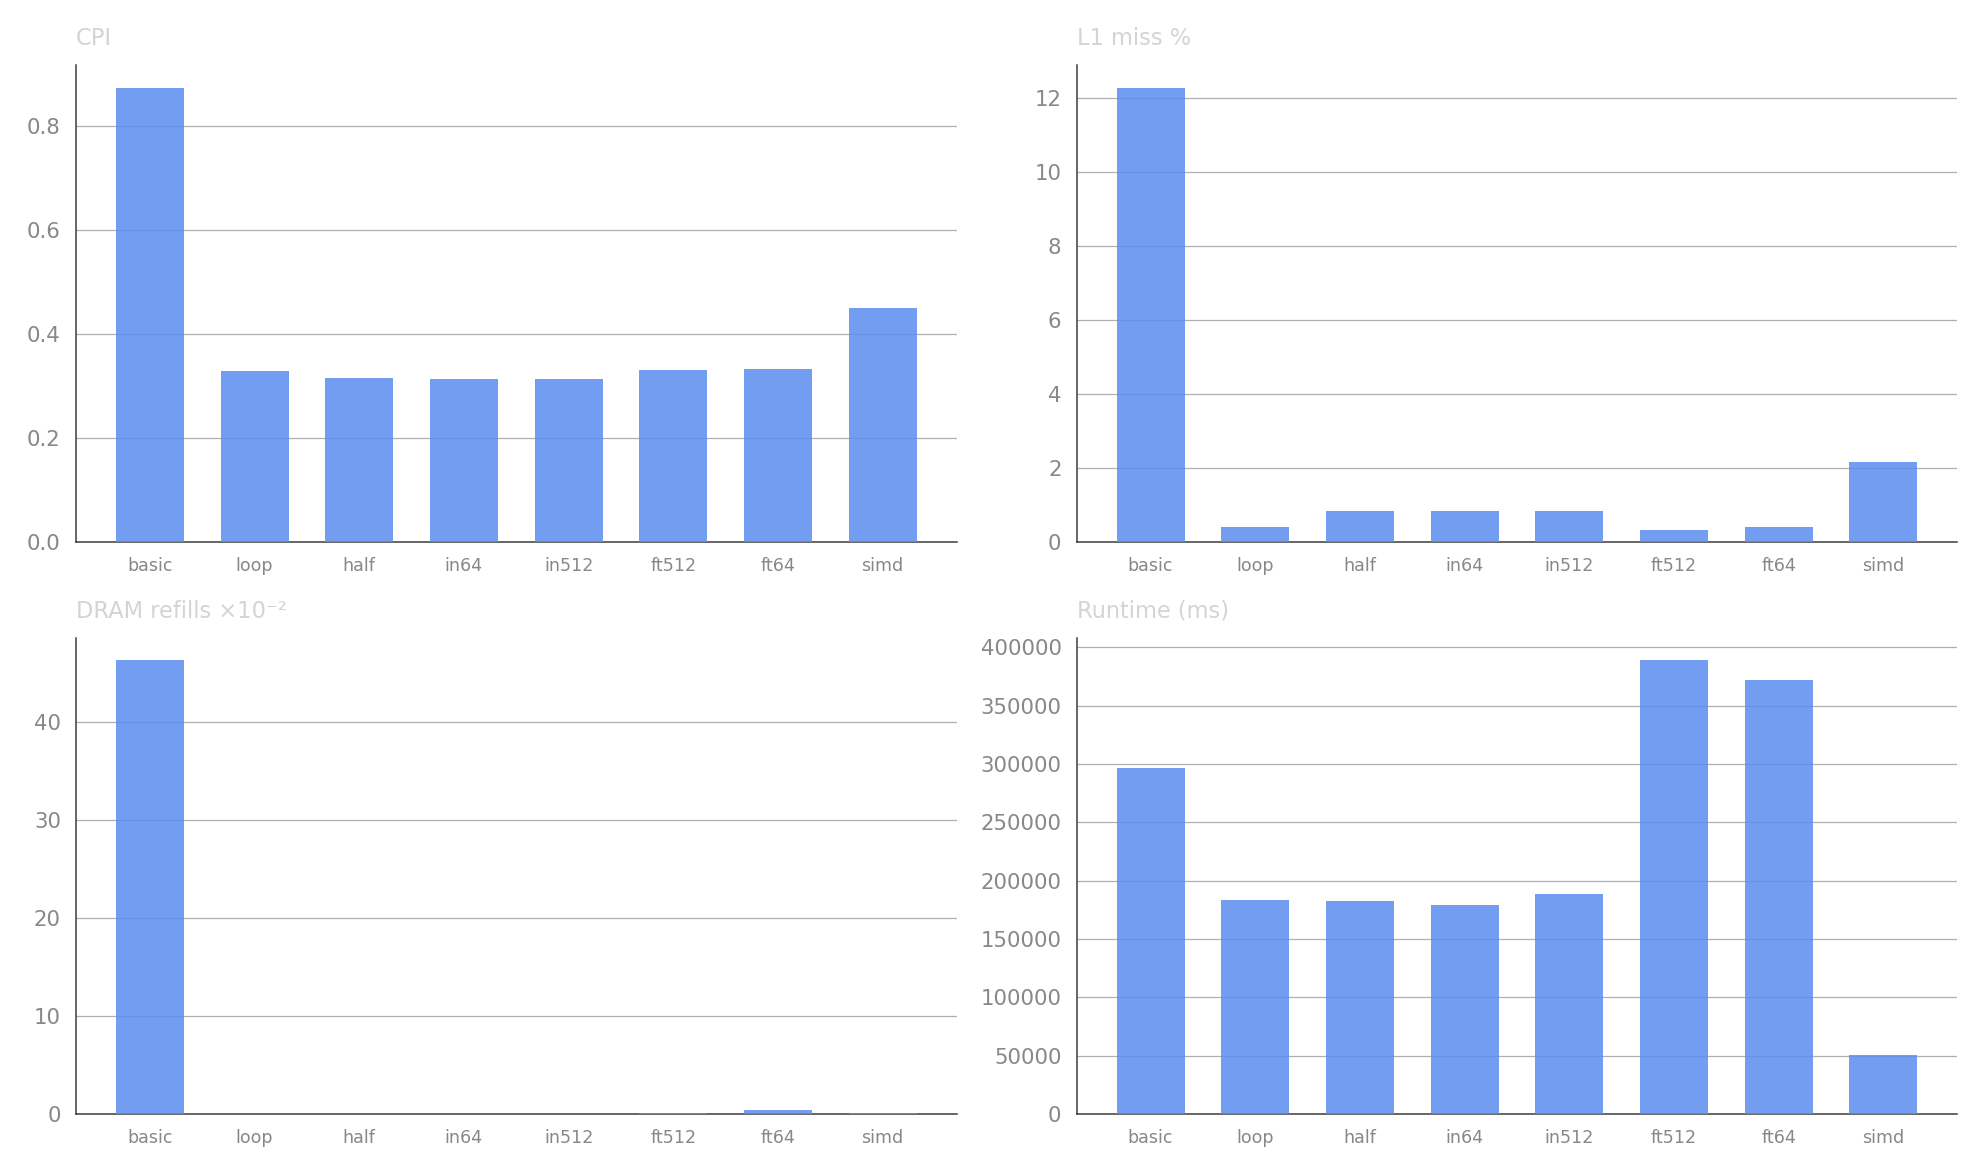
The uProf data confirms the same trends: loop reordering and tiling cut L1 miss rates by over 30× (from 12.3% to ~0.4%), while fully tiled variants regress in runtime despite even lower L1 miss rates. SIMD delivers the largest speedup at 5.87×.